%EF%B9%96itok=SMaPMfmO.jpg "Portrait of Sarah Tomlinson")


Broad Markets
- Stock markets across the globe continued their downward price trend last week amidst higher volatility as US/China trade rhetoric continued
- US tech stocks were hit the hardest, dropping by 2.7% on the week and 6.6% month-to-date, as President Trump’s decision to ban Huawei has had a ripple effect
- European stocks fell by 2% and Chinese stocks by 1%
- Commodity prices also fell, led by oil which dropped 6.6% on the week and a cumulative 7.4% m-t-d
- As uncertainty increased, investors looked for high-quality assets, pushing US Treasury bond yields lower and flattening the 2s/10s curve further (lowest level for the curve since the December stock market selloff, and the lowest absolute level in the 10y since Q3 2017)
- The US 3m/10y curve is once again negative as well, at levels seen during the financial crisis. Bond investors now expect an 80% chance of a rate cut by the end the year
- In Europe and Japan, front end yields rose, but long-term ones well, which can be interpreted as a bearish view on long term growth. This flight to quality also supported gold (see below)
- During this holiday-shortened week, investors will continue to focus on US/China trade discussions and insights into the choice for Britain’s next prime minister.
Gold
- Gold rose last week as global markets were ‘risk-off’ and the US dollar fell 0.4% (LBMA 0.1%, XAU 0.6%)
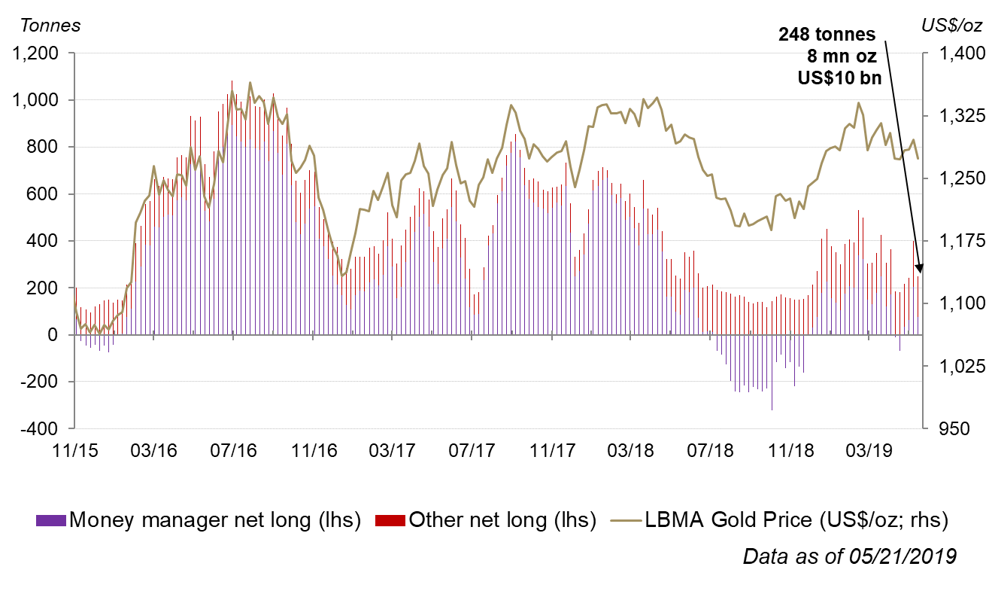
- COMEX net longs decreased meaningfully from 400t to 248t after increasing for three straight weeks after net speculative longs fell to nearly flat again
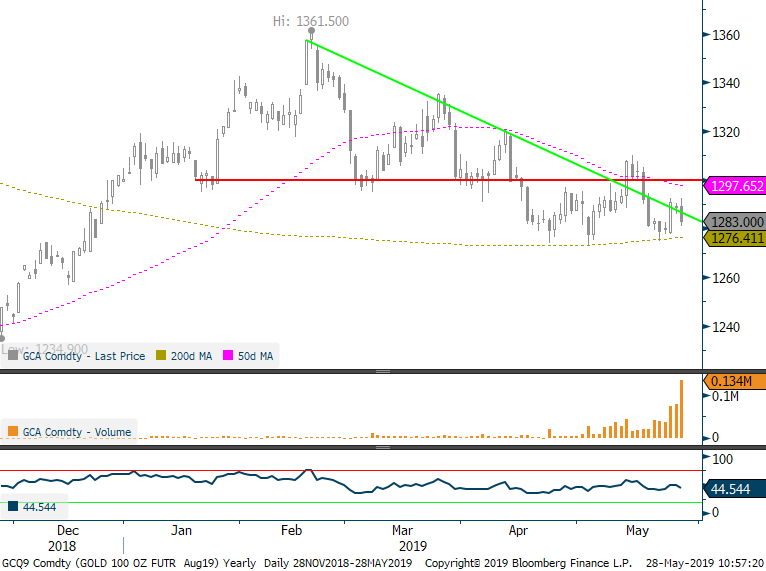
- May gold trading volumes increased last week and are now averaging $113bn a day in May; levels in line with the ytd average, but 9% over April averages
- Gold remains flat on the month and year, which is reflected by extremely low implied and realized volatility.